
Where to find Analytics
Navigate to:
Dashboard → Insights → Analytics
By default, Analytics shows data for this quarter, but you can easily adjust the time range and currency.
Filters & Controls
At the top of the page, you can refine the data using the following filters:
- Supplier
- Cost centers
- Company
- Asset type
- Motorisation type
- Cost type
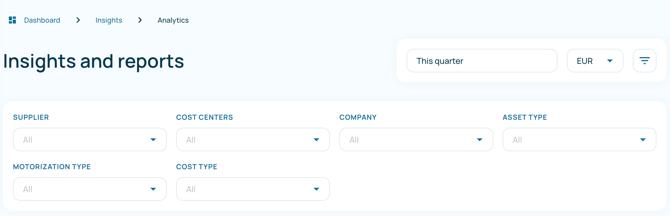
All filters can be combined to focus on exactly the data you need. If no filter is selected, results include all data.
Assets vs Consumption
Analytics is split into 4 main views:
-
General (default)
-
Assets
-
Consumption
-
Finance
General view
The General view provides a high-level overview of your fleet performance and key metrics. It helps you quickly understand fleet size, vehicle costs, contract status, and fleet age trends.
At the top of the page, you can apply filters such as time period, currency, and additional data filters to refine the information displayed.
Total vehicles cost
Shows the total cost associated with your vehicles over the selected period.
Costs are grouped by category, such as:
-
Consumption
-
Leasing
-
Other costs
This chart allows you to track how fleet costs evolve over time and understand which cost categories contribute most to your total expenses.
Ordered vehicles
Displays the number of vehicles that have been ordered but are not yet active.
This helps you anticipate upcoming changes in fleet size.
Average fleet age
Shows the average age of vehicles in your fleet, measured in months.
You can also view this information per company to compare fleet age across different entities.
Monitoring fleet age helps you:
-
identify aging vehicles
-
plan vehicle replacements
-
maintain an efficient and modern fleet
Assigned vs. unassigned vehicles
Provides a quick overview of vehicle allocation:
-
Assigned – vehicles currently linked to a driver or user
-
Unassigned – vehicles that are active but not currently allocated
This helps you quickly identify vehicles that may be available for assignment.
Active vehicles
Displays the number of active vehicles over time.
This trend view helps you monitor:
-
fleet growth
-
reductions in fleet size
-
periods of stability
Contracts expiring
Shows the number of vehicle contracts that are approaching their expiration date over time.
This allows fleet managers to:
-
anticipate contract renewals
-
plan vehicle replacements
-
avoid unexpected contract expirations
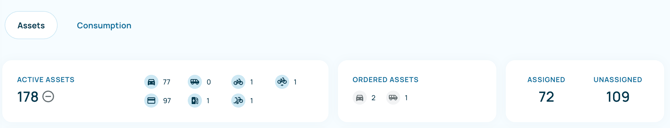
Assets
The Assets view focuses on availability, allocation, and movement of assets over time.
At the top of the Assets view, you’ll find a quick summary:
Active assets
Shows the total number of currently active assets, broken down by asset type (e.g. cars, bikes, charging cards).
Ordered assets
Displays assets that have been ordered but are not yet active.
Assigned vs unassigned
-
Assigned: assets currently linked to a driver or user
-
Unassigned: assets available but not yet allocated
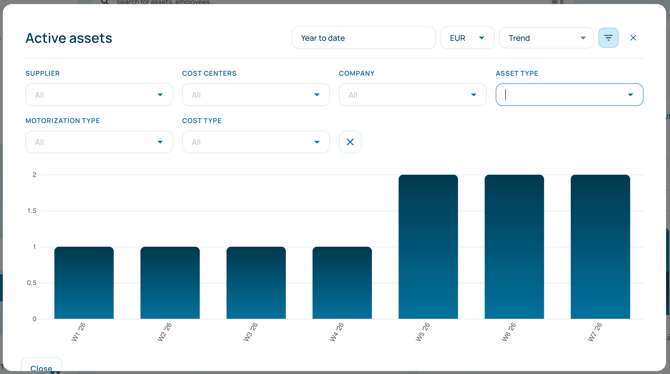
Active assets (Trend)
A weekly trend view showing how the number of active assets evolves over time.
Useful for identifying growth, reductions, or stability in your fleet.
(Tip: Use the expand icon to enlarge the view and apply filters)
Active cars and LCVs
Breaks down active vehicles by motorisation type:
-
Fossil
-
Hybrid
-
Electric
-
Unknown
This view helps track your fleet’s sustainability mix and monitor transitions to electric or hybrid vehicles.
Assets in / out
Shows assets that were:
-
Added
-
Removed
You can group this view per company, making it easy to track fleet changes across entities.
Total distance driven
Compares:
-
Actual distance driven
-
Contractual distance
Displayed over time, this chart helps you:
-
Monitor over- or under-utilisation
-
Identify contract risks
-
Anticipate adjustments before excess mileage occurs
Financing types
The Financing types view gives insight into how your assets are financed and how this evolves over time.
Assets are grouped by financing model, for example:
-
Leasing
-
Renting
Unassigned assets
The Unassigned assets view highlights assets that are currently active but not linked to a driver or user.
What you see
-
The total number of unassigned assets
-
How unassigned assets evolve over time
-
A breakdown by asset type (if applicable)
This makes it easy to identify assets that are available but not in use.
Consumption view
The Consumption view provides insight into your fleet’s fuel and electricity usage, energy costs, and environmental impact. It helps you monitor consumption trends, charging behaviour, and CO₂ emissions across your fleet.
At the top of the page, you will find key consumption indicators that summarise fleet performance over the selected period.
Fuel
Displays the total amount of fuel consumed by fossil-fuel vehicles during the selected period.
This metric helps you monitor fuel usage across your fleet.
Electricity
Shows the total electricity consumed for vehicle charging.
This includes charging sessions recorded through supported charging solutions.
Average usage
Displays the average distance driven per vehicle per day, measured in kilometres.
This metric helps you understand how intensively vehicles are being used.
Average CO₂
Shows the average CO₂ emissions per kilometre for your fleet.
This indicator helps monitor the environmental impact of your vehicles and track progress toward sustainability goals.
Total consumption cost
Displays the total cost associated with energy consumption, including:
-
Fossil fuel costs
-
Electricity costs
The chart shows how these costs evolve over time, helping you identify trends in energy spending.
Total CO₂
Shows the total CO₂ emissions generated by your fleet over the selected period.
Tracking this metric helps organisations monitor their environmental footprint and evaluate the impact of electrification initiatives.
Average consumption
Displays the average fuel consumption for fossil-fuel vehicles over time.
This helps you:
-
track fuel efficiency
-
identify vehicles with higher fuel consumption
-
monitor improvements in fleet efficiency
Average cost of energy
Shows the average cost of electricity per charging location, such as:
-
Public charging stations
-
Office charging
-
Home charging
This helps you compare charging costs across different locations.
Average energy per charge
Displays the average amount of energy consumed per charging session.
This metric helps you better understand charging behaviour and energy usage patterns.
Distribution of charging
Shows where vehicle charging occurs, broken down by location:
-
Station (public charging)
-
Office
-
Home
This view helps you analyse charging habits and understand how charging is distributed across different locations.
Finance view
The Finance view provides insight into the financial performance of your mobility ecosystem. It helps you monitor overall mobility costs, analyse spending by mobility type, and understand how costs evolve across vehicles, suppliers, and organisations.
At the top of the page, key financial indicators summarise your mobility spending over the selected period.
Total mobility cost
Displays the total cost of mobility services across your organisation.
This includes expenses related to:
-
Cars and LCVs
-
Public transport
-
Shared mobility
This metric provides a quick overview of your organisation’s total mobility spending.
Average mobility cost per employee
Shows the average monthly mobility cost per employee.
This indicator helps organisations monitor the overall cost of mobility benefits and track how mobility spending evolves relative to workforce size.
Average cost per vehicle
Displays the average monthly cost per vehicle in your fleet.
Costs can be broken down by category, such as:
-
Consumption
-
Leasing
-
Insurance
-
Other costs
This helps you better understand the financial structure of your fleet.
Total mobility cost (trend)
Shows how total mobility costs evolve over time.
Costs are typically grouped by mobility type, such as:
-
Cars and LCVs
-
Public transport
-
Shared mobility
This chart helps identify spending trends and monitor changes in mobility expenses.
Car and LCV costs
Provides a detailed view of vehicle-related costs.
Costs can be analysed using different perspectives, including:
-
Per brand
-
Trend over time
-
Per company
-
Per cost center
-
Per supplier
-
Cost breakdown by category
This view helps organisations understand where vehicle costs originate and how they are distributed.
Public transport costs
Displays costs related to public transport usage.
You can analyse these costs by different dimensions, such as supplier, allowing you to understand which providers contribute most to your mobility spending.
This view helps organisations monitor public transport usage and associated expenses.